fourier-piano
Some functionality to project Fourier transformed signals on a piano backdrop. The method can be used to easily identify what notes are in a chord or a melody.
Visualizing the Fourier transform on a piano
As a musician and electrical engineer I like to think about the Fourier transform as a piano.
A common way of plotting the Fourier transform
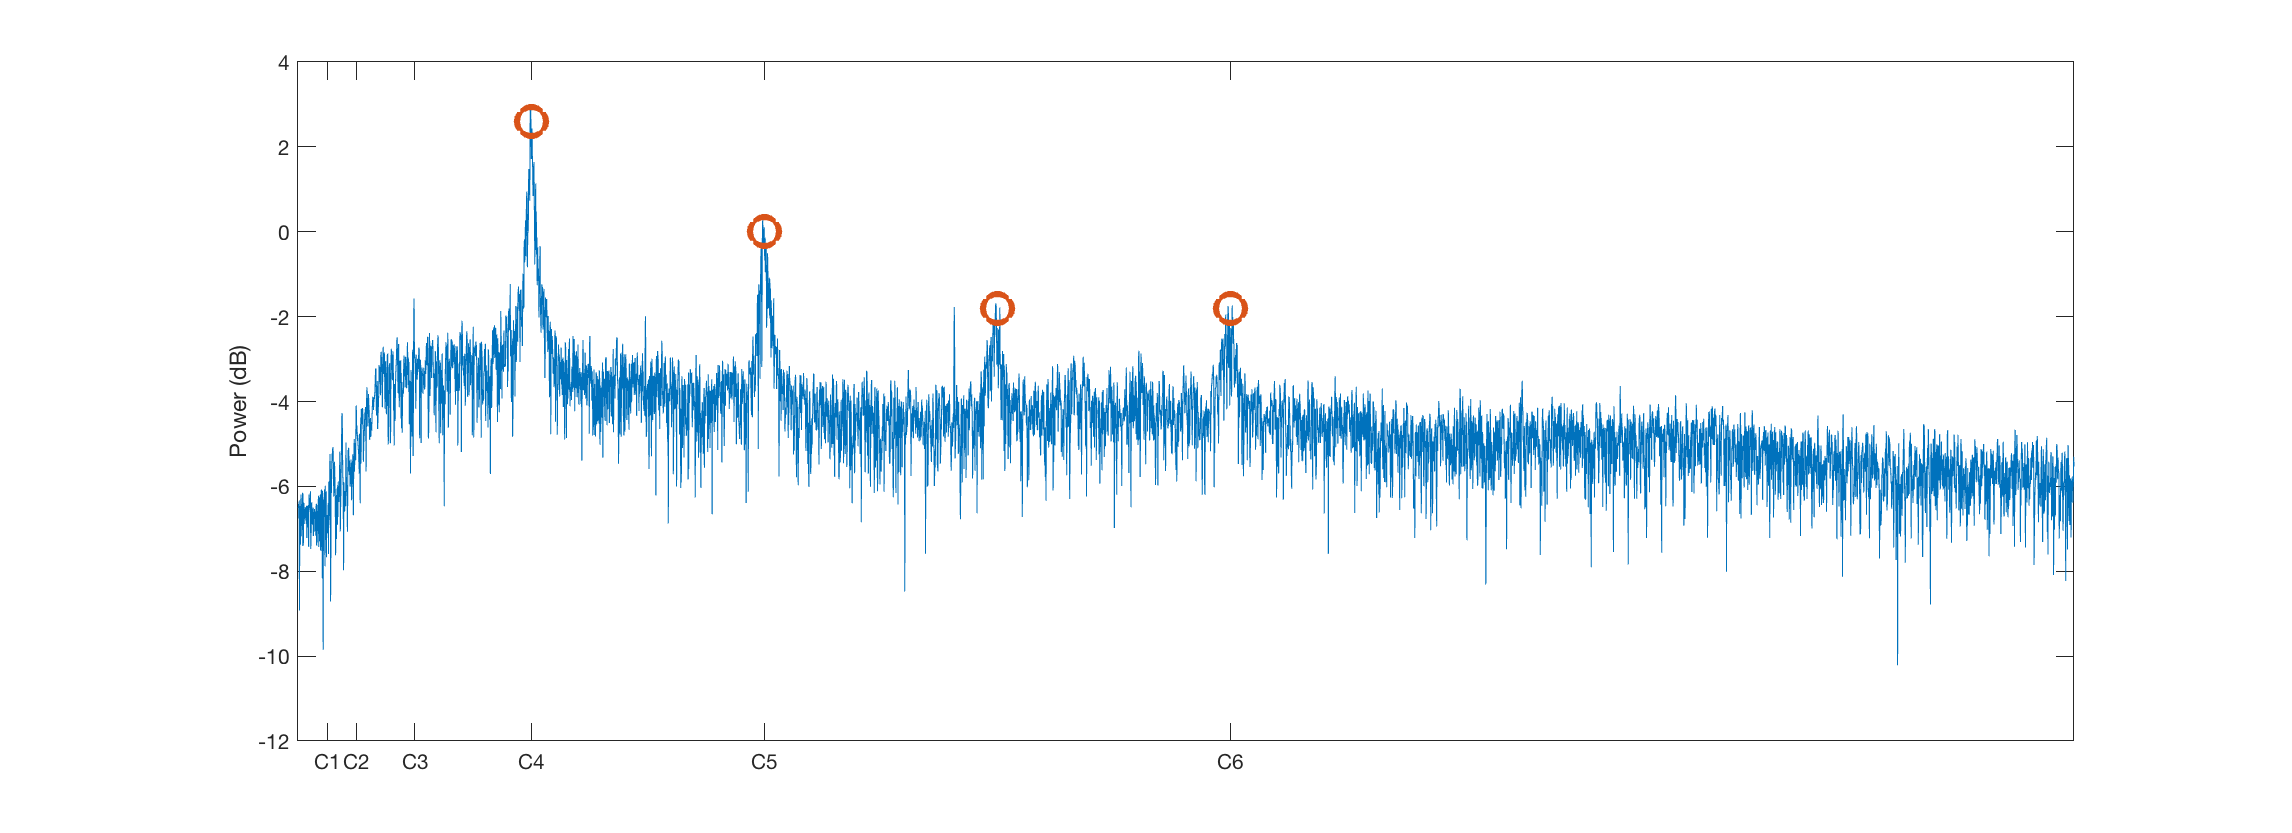
The signal is me humming a C4. We see the overtones C5, G5 and C6 in the plot.
Another way of plotting the Fourier transform
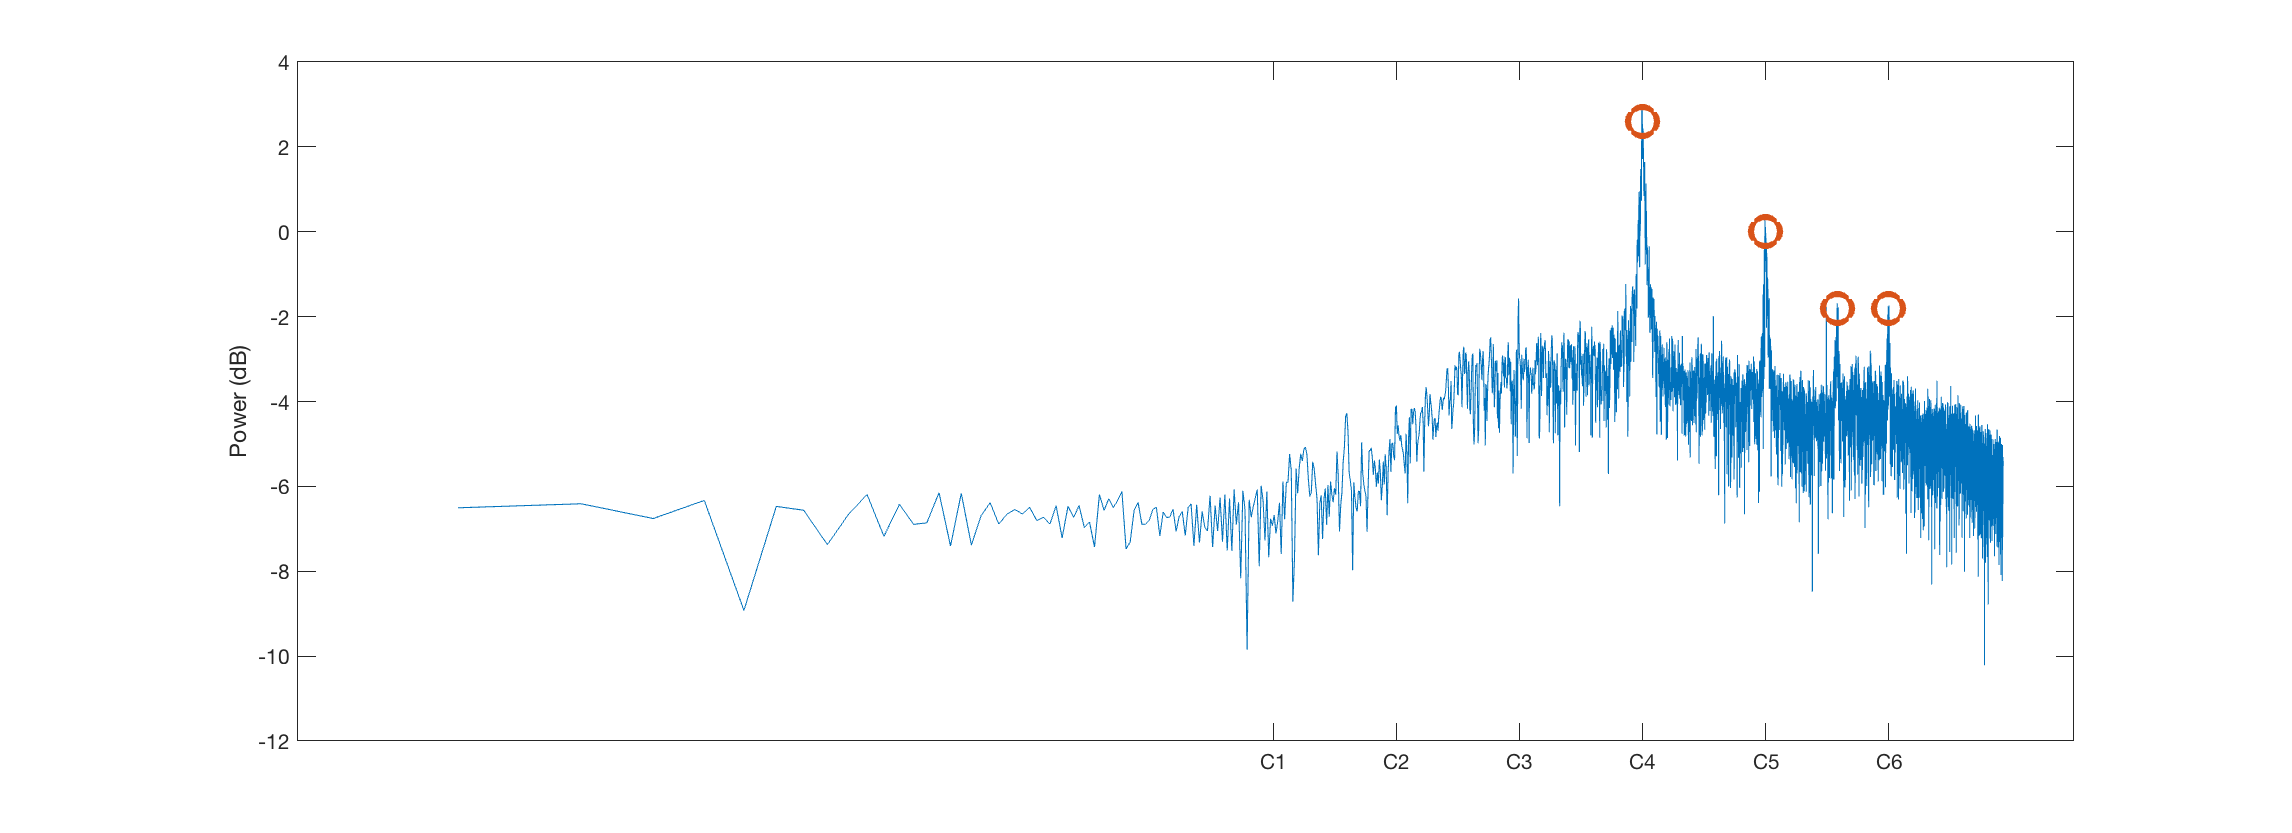
The same signal (me humming a C4), but the horizontal axis has been scaled logarithmically. Consequentially, the octaves are now equally spaced, much like on a piano!
Plotting the Fourier transform on a piano
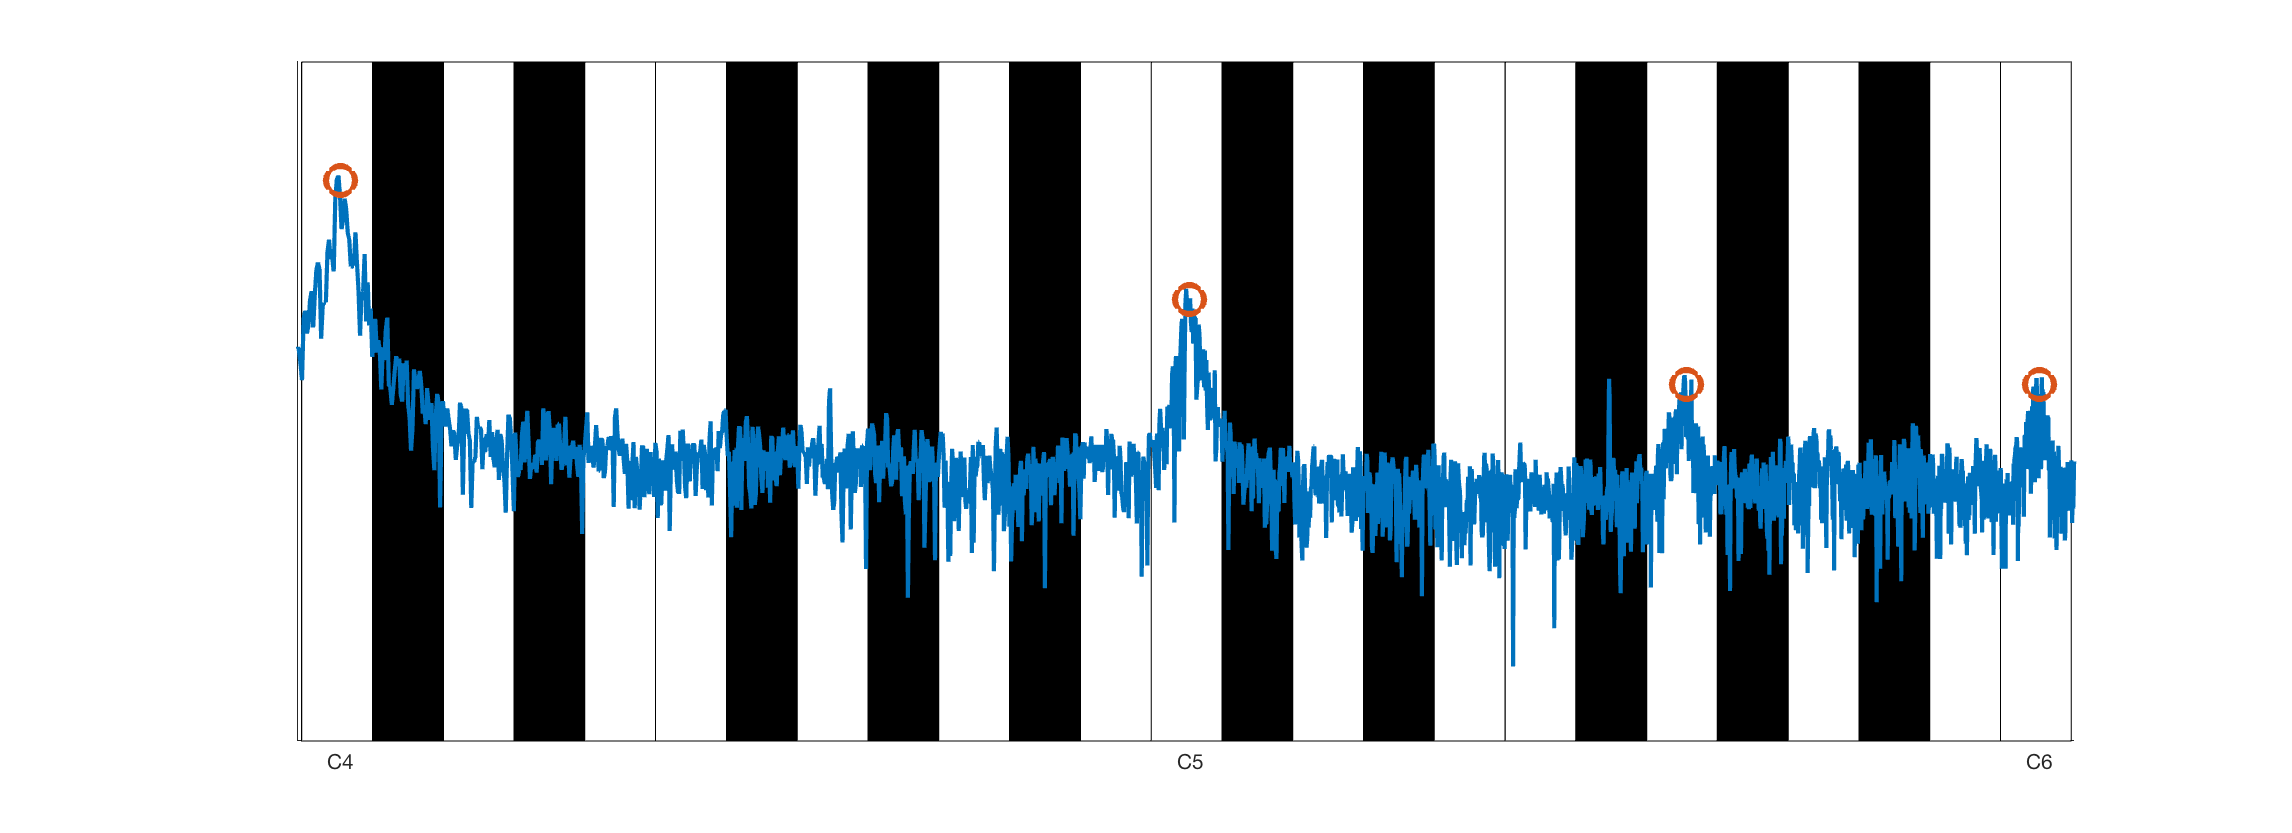
Now we can easily project the power spectrum on a piano backdrop.
load('train.mat')
Analysis of the Matlab built-in “train whistles” sound byte. We see that it is composed of an inverted D minor chord
Twin Peaks Theme
Using this visual support, it becomes pretty easy to transcribe the cluster chords:
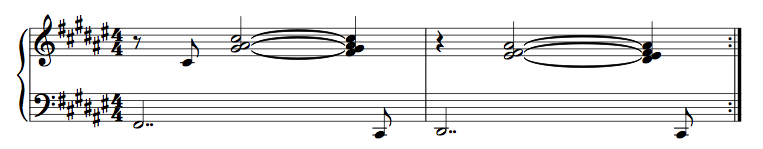
Simon Åkesson’s Gbmaj7#9#11no3
Audio from Gbmaj7#9#11no3.